One of the challenges faced by livestock keepers in developing countries is the need to improve productivity per animal and per unit area of land. The most common question asked to those promoting animal genetic improvement is: ‘what is the best animal?’. To determine an answer to the question of what is best, one must know the traits of importance (See Module 2, Section 4) and how performance in the traits interacts with the available environment.
A second basic question is: ‘how do you breed animals so that their descendants will be better than today’s animals?’. In other words, how are animal populations improved to maximize profitability over time? The purpose of animal breeding is not to genetically improve individual animals, but to improve animal populations. To improve populations, basic tools are required to identify and utilize genetic differences between animals for the traits of interest.
The vast majority of traits of interest are polygenic. The higher the number of genes that affect a given trait, the more difficult it is to observe and separate the effects of the individual genes. Phenotypes for polygenic traits are typically quantitative in their expression, and thus can be numerically measured. Quantitative methods are research techniques that are used to gather quantitative data—they are research methods dealing with numbers and anything that is measurable. Statistical analyses are often used to evaluate and present the results of these methods.
Statistics to separate genetic and environmental effects
The observed characteristics of animals, which make up the phenotype of the animal, are affected by both genetic and environmental factors. The genetic factors are due to a random sample of genes received from the two parental gametes, whereas the environmental factors include influences by climate, nutrition, health and management. Genetic analyses in the field of AnGR usually aim at separating genetic and environmental effects. Statistical values for means, variances and the relationship between different variances are used to develop basic analytical principles. For this, a mathematical model is needed which describes the phenotypic values as a function of genotype and environment, i.e. phenotype = f (genotype, environment). The simplest and most frequently used function f is the linear ‘pattern plus residual’ model. As the genotype is our main interest, we start by defining a genotypic value as G, the ‘pattern’ part of the phenotypic observation as P and the residual P - G as an environmental effect E, explaining the discrepancy between the phenotypic and genotypic values. The simplest model to describe the above relationships is that of Falconer and Mackay (1996) presented as:
P = µ + G + E
where µ = the population mean for the trait. It is the average phenotypic value of all individuals in a population. Means vary greatly with breed, management and physical environment.
The reason for adding the population mean is to emphasize that in animal breeding, genotypic values, environmental effects and all other elements of the genetic model are not absolute values but are expressed relative to the mean of the population being considered
When dealing with very different environments or when dealing with different genotypes within a given environment, it is important to include the specific combination effects between genotype and environment (G × E) (See Module 2, Section 3.4); [CS 1.39 Okeyo and Baker].
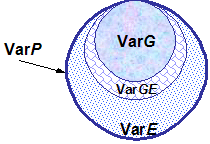
When considering breeds or populations of animals, P and G are expressed as deviations from the population mean. The variation within the population can be described and illustrated as follows:
|
VarP = VarG + VarE + Var(G×E) |
|
|
where Var P, VarG and VarE refer to phenotypic, genetic and environmental variance respectively and Var(G × E) is the variance due to the genotype by environment interaction. Variation refers to differences among individuals within a population. Genetic variation is the source of all genetic improvement.
Once the importance of the environmental and genetic factors for a specified trait has been established, methods of genetic improvement for that trait can be explored. Clearly, there is little or no point in attempting to improve livestock by genetic means if there is no or very small genetic variation in the trait. One must therefore determine the extent to which genetic effects influence a phenotype (Module 2 Section 3.2), and to what extent the genetic effects are due to separately acting genes, i.e. additive genetic effects, before designing breeding programmes accordingly.
With a single individual it is not possible to separate the effects of genetic and environmental factors; neither is it possible to estimate how much of its phenotypic level is due to each factor. However, with groups of livestock, estimates of the relative importance of the environmental factors, genetic factors and interaction between the two factors can be obtained. The quantitative genetic methods reviewed in sections 1.2–1.4 provide powerful tools for analysing and handling quantitative variation in practical breeding.
Statistics to determine relationships between traits
In addition to evaluating variation within a trait, it is important to understand how two or more traits or different values may vary together, covariation. Knowing that any two or more genes often affect more than one trait (pleiotropy), sometimes in the opposite and sometimes in the same direction, the phenomenon of covariation is important. Covariation between two or more traits can also be caused by genetic linkage between loci affecting the traits. Understanding covariation helps in predicting possible effects of selection and hence in making decisions when selecting for a specific trait. The sign (positive or negative) and magnitude of the relationship between the traits to be selected must be taken into account and means sought to achieve the desirable result when it is evident that selection in one trait will cause a negative response in another related trait. The correlation coefficient gives a measure of the strength of the relationship between two variables (or traits). As with variance, useful correlations are phenotypic, genetic and environmental correlations. The amount of change in one variable that can be expected for a given amount of change in another variable is measured by a regression coefficient. This can be expressed on both the phenotypic and genotypic scales and is related to the phenotypic and genetic correlations between the two variables. The regression coefficient is useful for prediction based on other pieces of information. For example, the regression of breeding value for a trait on phenotypic value for the same trait is used to help predict an animal’s breeding value based on its own performance.
Use of statistics to estimate genetic diversity from molecular data
Genetic diversity is the basis for both natural evolutionary changes and artificial selection in breeding populations. The importance of genetic diversity and measures of genetic diversity in livestock production are described in Section 3, Module 2. The section also describes molecular genetics techniques that can be used to collect data for studies on genetic diversity. Maintaining a healthy balance between adequate genetic variation in today’s livestock populations in order to exploit it through selection, while aiming to achieve product uniformity and breed identity remains a constant challenge. In this module, some quantitative methods that are used to analyse molecular data to measure genetic diversity in populations (Section 7 this module) and genetic relationships between populations (Section 8 this module) are reviewed.
Statistics for deciphering effects of genes
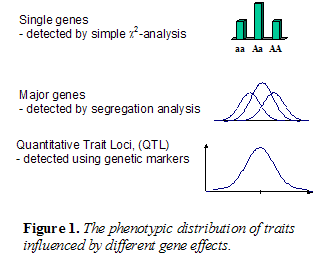
Currently, there is much emphasis on studies of the molecular genetic background of traits in livestock. The majority of production, functional and health traits are the consequences of complex physiological systems in the animal influenced by a large number of genes and varying gene interactions. The genetic basis for such quantitative traits can neither be fully clarified nor considered in full detail, as is possible for qualitative traits, such as coat colour. However, among all loci affecting a quantitative trait, i.e. quantitative trait loci (QTL), some contribute more and some less to the variation between individuals. Different quantitative methods have thus been developed for analysing phenotypic and molecular genetic data. Until recently, it was not possible to identify QTL, except the ones with the largest effects, the so-called major genes (Figure 1). They can be detected by segregation analysis, i.e. as deviations from the unimodal phenotypic distribution of the character. Examples of such major genes are the Culard (mh) gene causing muscular hypertrophy in cattle, the Boroola gene increasing fecundity in sheep etc.

As compared to studies of phenotypic distributions of traits, studies of linkage and linkage disequilibrium between genetic markers and QTL provide a more powerful and robust tool to detect QTL. Thus, the development of relatively dense linkage maps with highly informative markers (Module 2 section 3.3) has made it possible to identify and localize QTL for many economically important traits in livestock species. For the detection of QTL, it is essential to make use of efficient statistical methods (Section 6.1, this module).

